$2.2M saved a year and fill rate up 15 points by consolidating two DCs into one
Network Design Multi-mode Entertainment
62b3363bec6b8687e9ace1fc71497c64da7fef1f

WHO

Business model

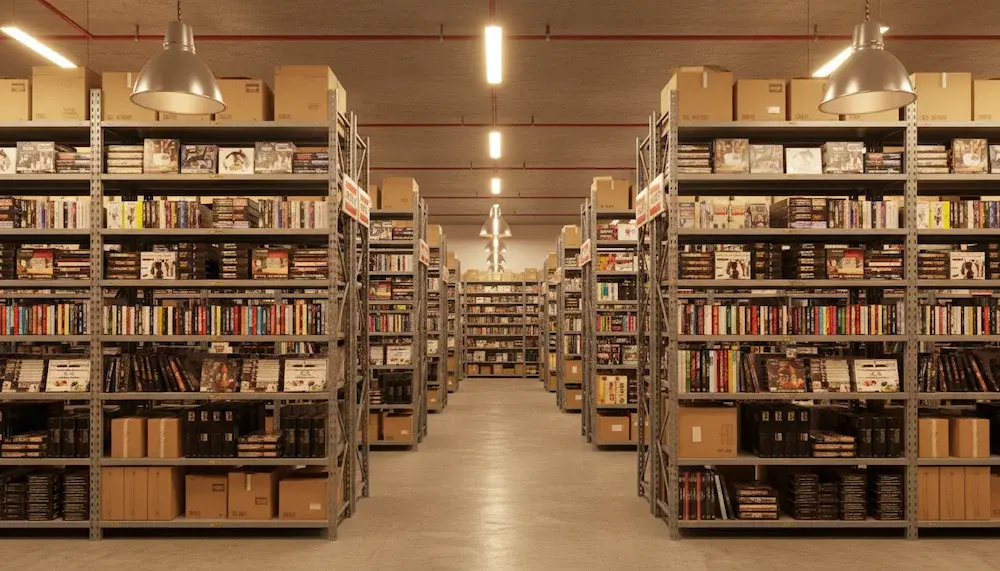
An industry leading manufacturer that produces and distributes recorded music and DVDs for a large entertainment company, running two distribution centers with overlapping coverage.

Industry

Entertainment. High order volumes, and customers who measure the relationship on fill rate.

PROBLEM

What they felt

The client, like most companies, was looking for synergies across its distribution network, but needed to reduce costs without jeopardizing service.

What we found

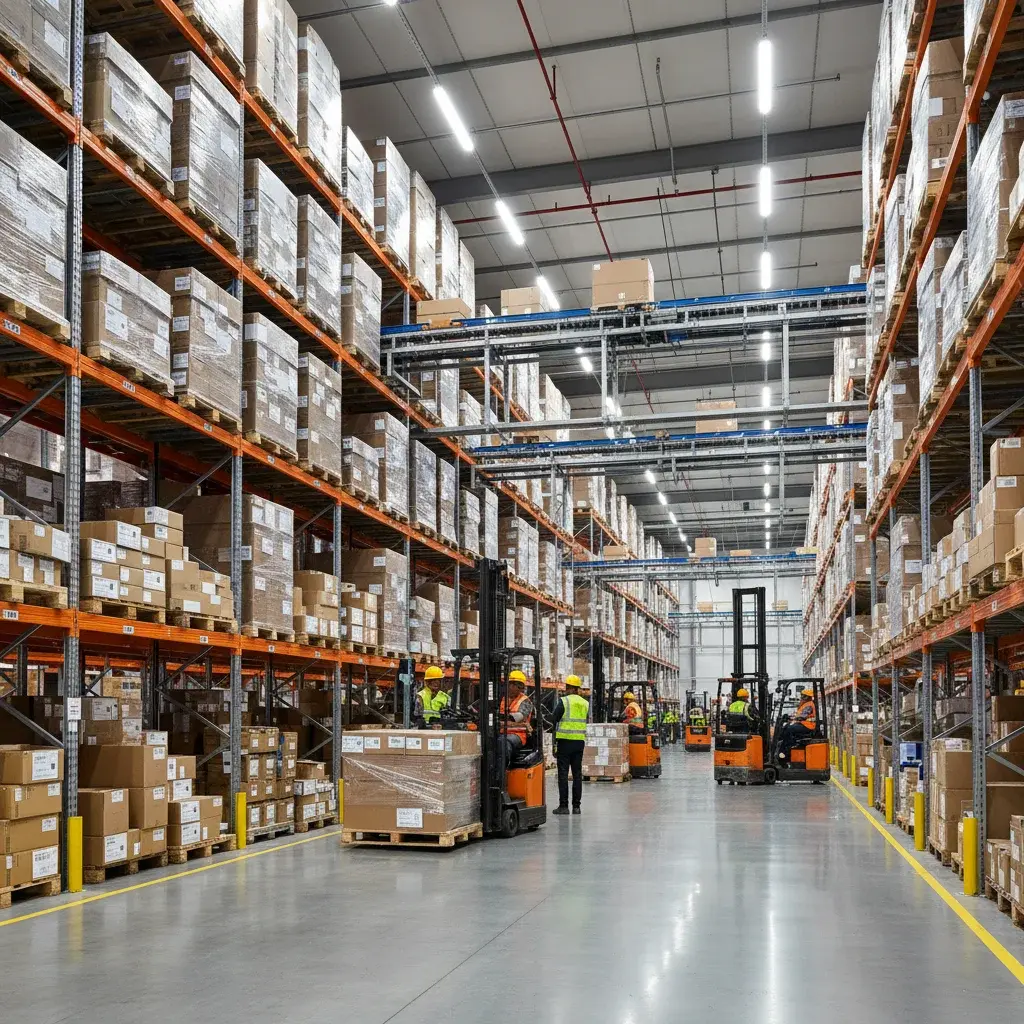
The client had overlaps in distribution and wanted to know if they could consolidate warehouses. One DC fulfilled less "time critical" product to the southeastern U.S. from Chicago, and another shipped fast moving inventory from Atlanta. They wanted to know the financial impact of consolidating and fulfilling all inventory from the Chicago facility.

WHAT WE DID

Prep and analysis

Trans-solutions was brought in for its extensive experience in modeling. We built a model of current distribution, transportation and inventory cost and aligned the actual service, so alternative distribution strategies could then be accurately compared.

Execution

New time in transit and cost structures were calculated for the consolidated solution and compared against the current network. With our proprietary software, Xact Negotiator, the actual cost changes and service shift were calculated.

We modeled service alongside cost

The point was never to prove the consolidation. It was to find out whether service would hold, which is why the cost variance was measured against actual delivery performance rather than against averages.

RESULTS

What they got

$2,200,000 saved a year, and the consolidation justified

$2,200,000 saved annually. Although some costs went up, the overall logistics cost went down and justified the consolidation.

Service got better rather than worse. Inventory management improved, order fill rate went up by 15%, and customers received fewer and larger shipments, which reduced their costs while saving millions of dollars for our client.

How much are you leaving on the table?

Get an instant calculation of your savings potential. Based on the database of carrier contracts we have audited and negotiated for 600+ clients since 1997, and on current benchmark data showing what companies with your profile pay today.

Ready to get started?